Canada's Air

Canadians enjoy a good level of outdoor air quality. Emissions of air pollutants that cause smog and acid rain have decreased significantly during the past decades. These reductions have contributed to the reduction of the air pollutants that Canadians breathe every day – pollutants that can contribute to health issues such as asthma and cardiovascular diseases.

While significant progress has been made to reduce air pollution, poor air quality remains a serious issue in some areas of Canada. Canadians living in heavily populated and industrialized areas of the country may be exposed to potentially harmful levels of outdoor air pollutants, at concentrations that exceeded established standards. Air pollutants such as fine particulate matter and ground-level ozone, the major components of smog, can adversely affect the health of Canadians, especially small children, the elderly, and those with heart and lung conditions, even at low concentrations.

This website provides information on the Air Quality Management System, air quality across Canada, air pollution and its effects, and actions to improve the air that we breathe.

Air Quality Management System

  • In order to better protect human health and the environment, in 2012 ministers of the environment, with the exception of Québec, agreed to implement a new Air Quality Management System (AQMS) to guide work on air emissions across Canada.
  • AQMS is a comprehensive and collaborative approach by federal, provincial and territorial governments to reduce the emissions and ambient concentrations of various pollutants of concern.
  • AQMS provides a framework for collaborative action across Canada to further protect human health and the environment from harmful air pollutants through continuous improvement of air quality.

Although Québec supports the general objectives of the AQMS, it will not implement the system since it includes federal industrial emission requirements that duplicate Québec’s regulation. However, Québec is collaborating with jurisdictions on developing other elements of the system, notably air zones and airsheds.

Foundation

Collaboration and Accountability

AQMS was built on a foundation of collaboration, accountability and transparency. Industry, non-governmental and Indigenous organizations worked with governments to develop AQMS, they continue to monitor implementation of AQMS and participate in its ongoing development and improvement, including actions to address mobile sources.

Monitoring and public reporting are critical to transparency, accountability and the effective implementation of the system. Provinces and territories, with assistance from the federal government, are responsible for monitoring air pollutants in their air zones and for reporting to their constituents about air quality and actions taken to implement AQMS. Provinces and territories will produce annual air zone reports that include information on achievement of the CAAQS, air quality issues and trends, and the air management level in each air zone.

Driver

CAAQS

Canadian Ambient Air Quality Standards (CAAQS) are developed as a key element of the Air Quality Management System to drive improvement of air quality across Canada. CAAQS have been developed for nitrogen dioxide (NO2), sulphur dioxide (SO2), fine particulate matter (PM2.5) and ozone (O3). Ongoing reviews of the CAAQS help ensure they reflect the latest scientific information. The CAAQS are established as air quality objectives under the Canadian Environmental Protection Act, 1999.

Mechanisms

Air Zone Management

To assist with air quality management, provinces and territories have defined smaller geographic areas called air zones that divide their jurisdiction and that have unique air quality characteristics. These characteristics may include pollutant sources, topography, meteorological patterns, population density and other potential factors that influence ambient air concentrations.

Industrial Emissions Requirements

Base-level Industrial Emissions Requirements (BLIERs) are intended to ensure that all significant industrial sources in Canada, regardless of where facilities are located, meet a good base-level of performance. BLIERs are quantitative or qualitative emissions requirements proposed for new and existing major industrial sectors and some equipment types. BLIERs are focused on nitrogen oxides (NOx), sulphur dioxide (SO2), volatile organic compounds (VOCs) and particulate matter (PM).

Airshed Coordination

Six regional airsheds cover all of Canada and allow for coordination and joint action in resolving issues involving the movement of air pollutants across provincial/territorial boundaries and international borders. These airsheds were developed taking larger scale issues, such as the movement of large air masses, typical long-term meteorological conditions, topography and air zone boundaries into consideration.

Mobile Sources

AQMS includes work to address emissions from mobile sources. The work builds on the existing range of federal, provincial and territorial initiatives aimed at reducing emissions from the transportation sector.

Air Pollutants

The air pollutants included in this report are:

Particulate Matter (PM)

Particulate matter (PM), a major component of smog, consists of airborne particles in solid or liquid form. PM may be classified as primary or secondary, depending on the process that led to its formation. Primary PM is emitted directly into the atmosphere from a source, such as a smokestack or exhaust pipe, or from wind-blown soils or vehicle traffic on a dirt road. Secondary PM is formed in the atmosphere through a series of chemical and physical reactions involving gases such as sulphur oxides (SOx) and nitrogen oxides (NOx). PM exists in various sizes and the particles of most concern for human health are those with a diameter of less than 2.5 micrometres (PM2.5).

Ground-level ozone (O3)

Ground-level ozone (O3), is a colourless, odourless and highly irritating gas that forms close to the Earth’s surface. O3 is a major component of smog. In contrast to “primary” pollutants which are emitted directly into the atmosphere from a source, O3 is considered a “secondary” pollutant because it is formed through complex chemical reactions between nitrogen oxides (NOx) and volatile organic compounds (VOCs) in the presence of sunlight. While O3 at ground-level is a significant environmental and health concern, approximately 10 to 40 kilometres above the Earth's surface, there is a beneficial layer of stratospheric ozone which shields the earth from harmful ultraviolet radiation. Ozone is also a short-lived climate pollutant and also contributes to climate change.

Nitrogen dioxide (NO2)

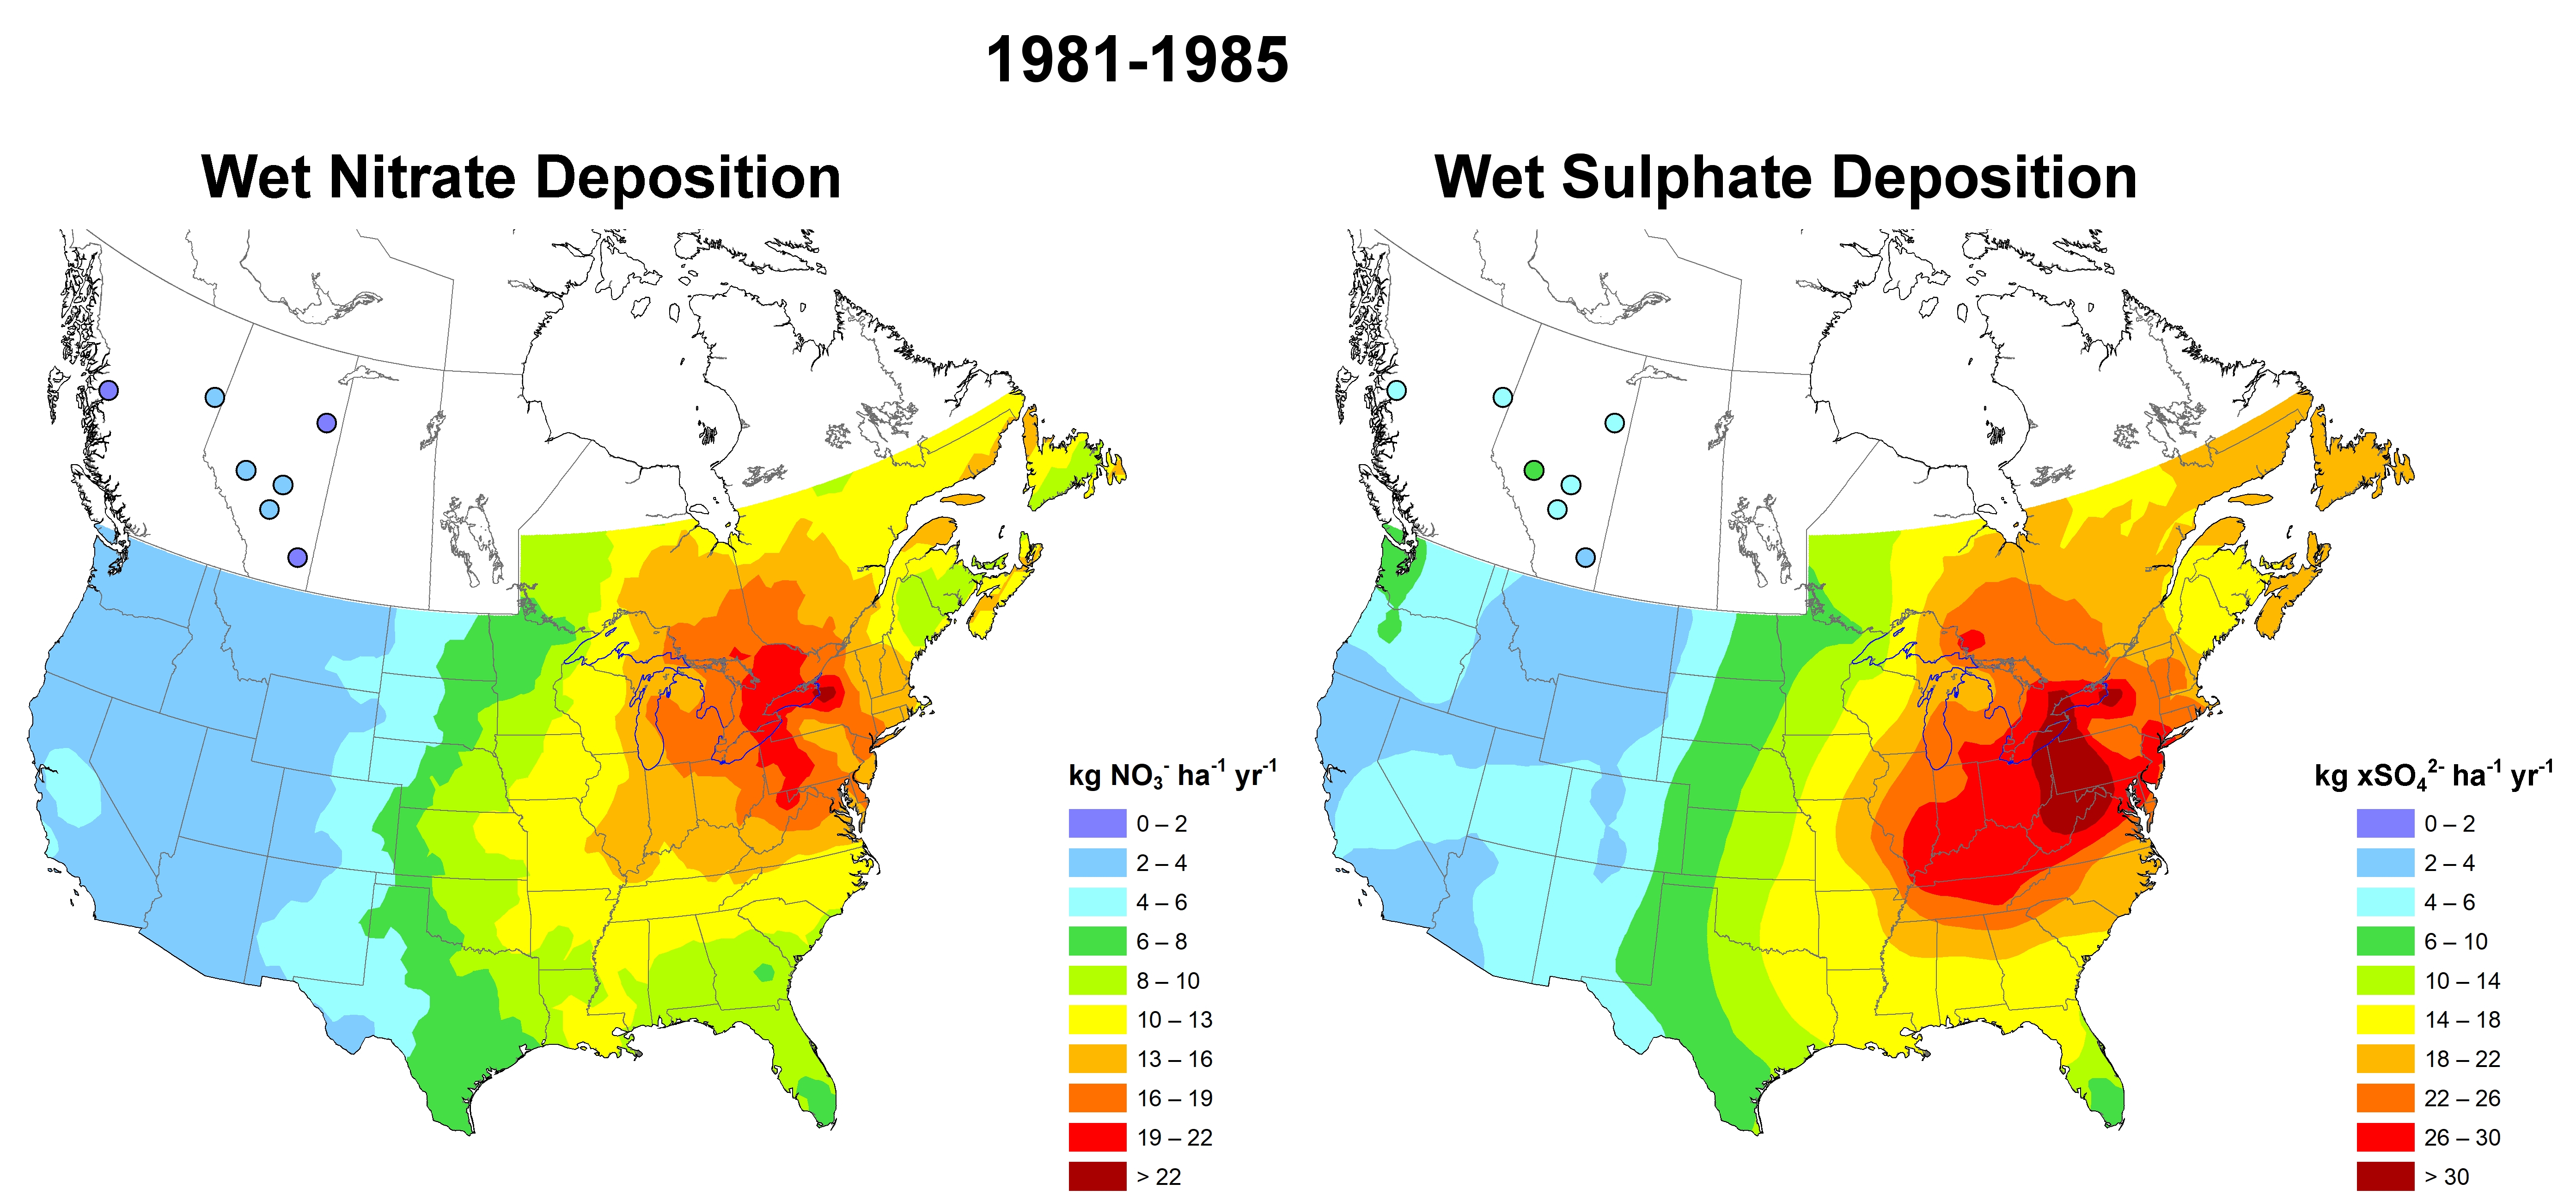
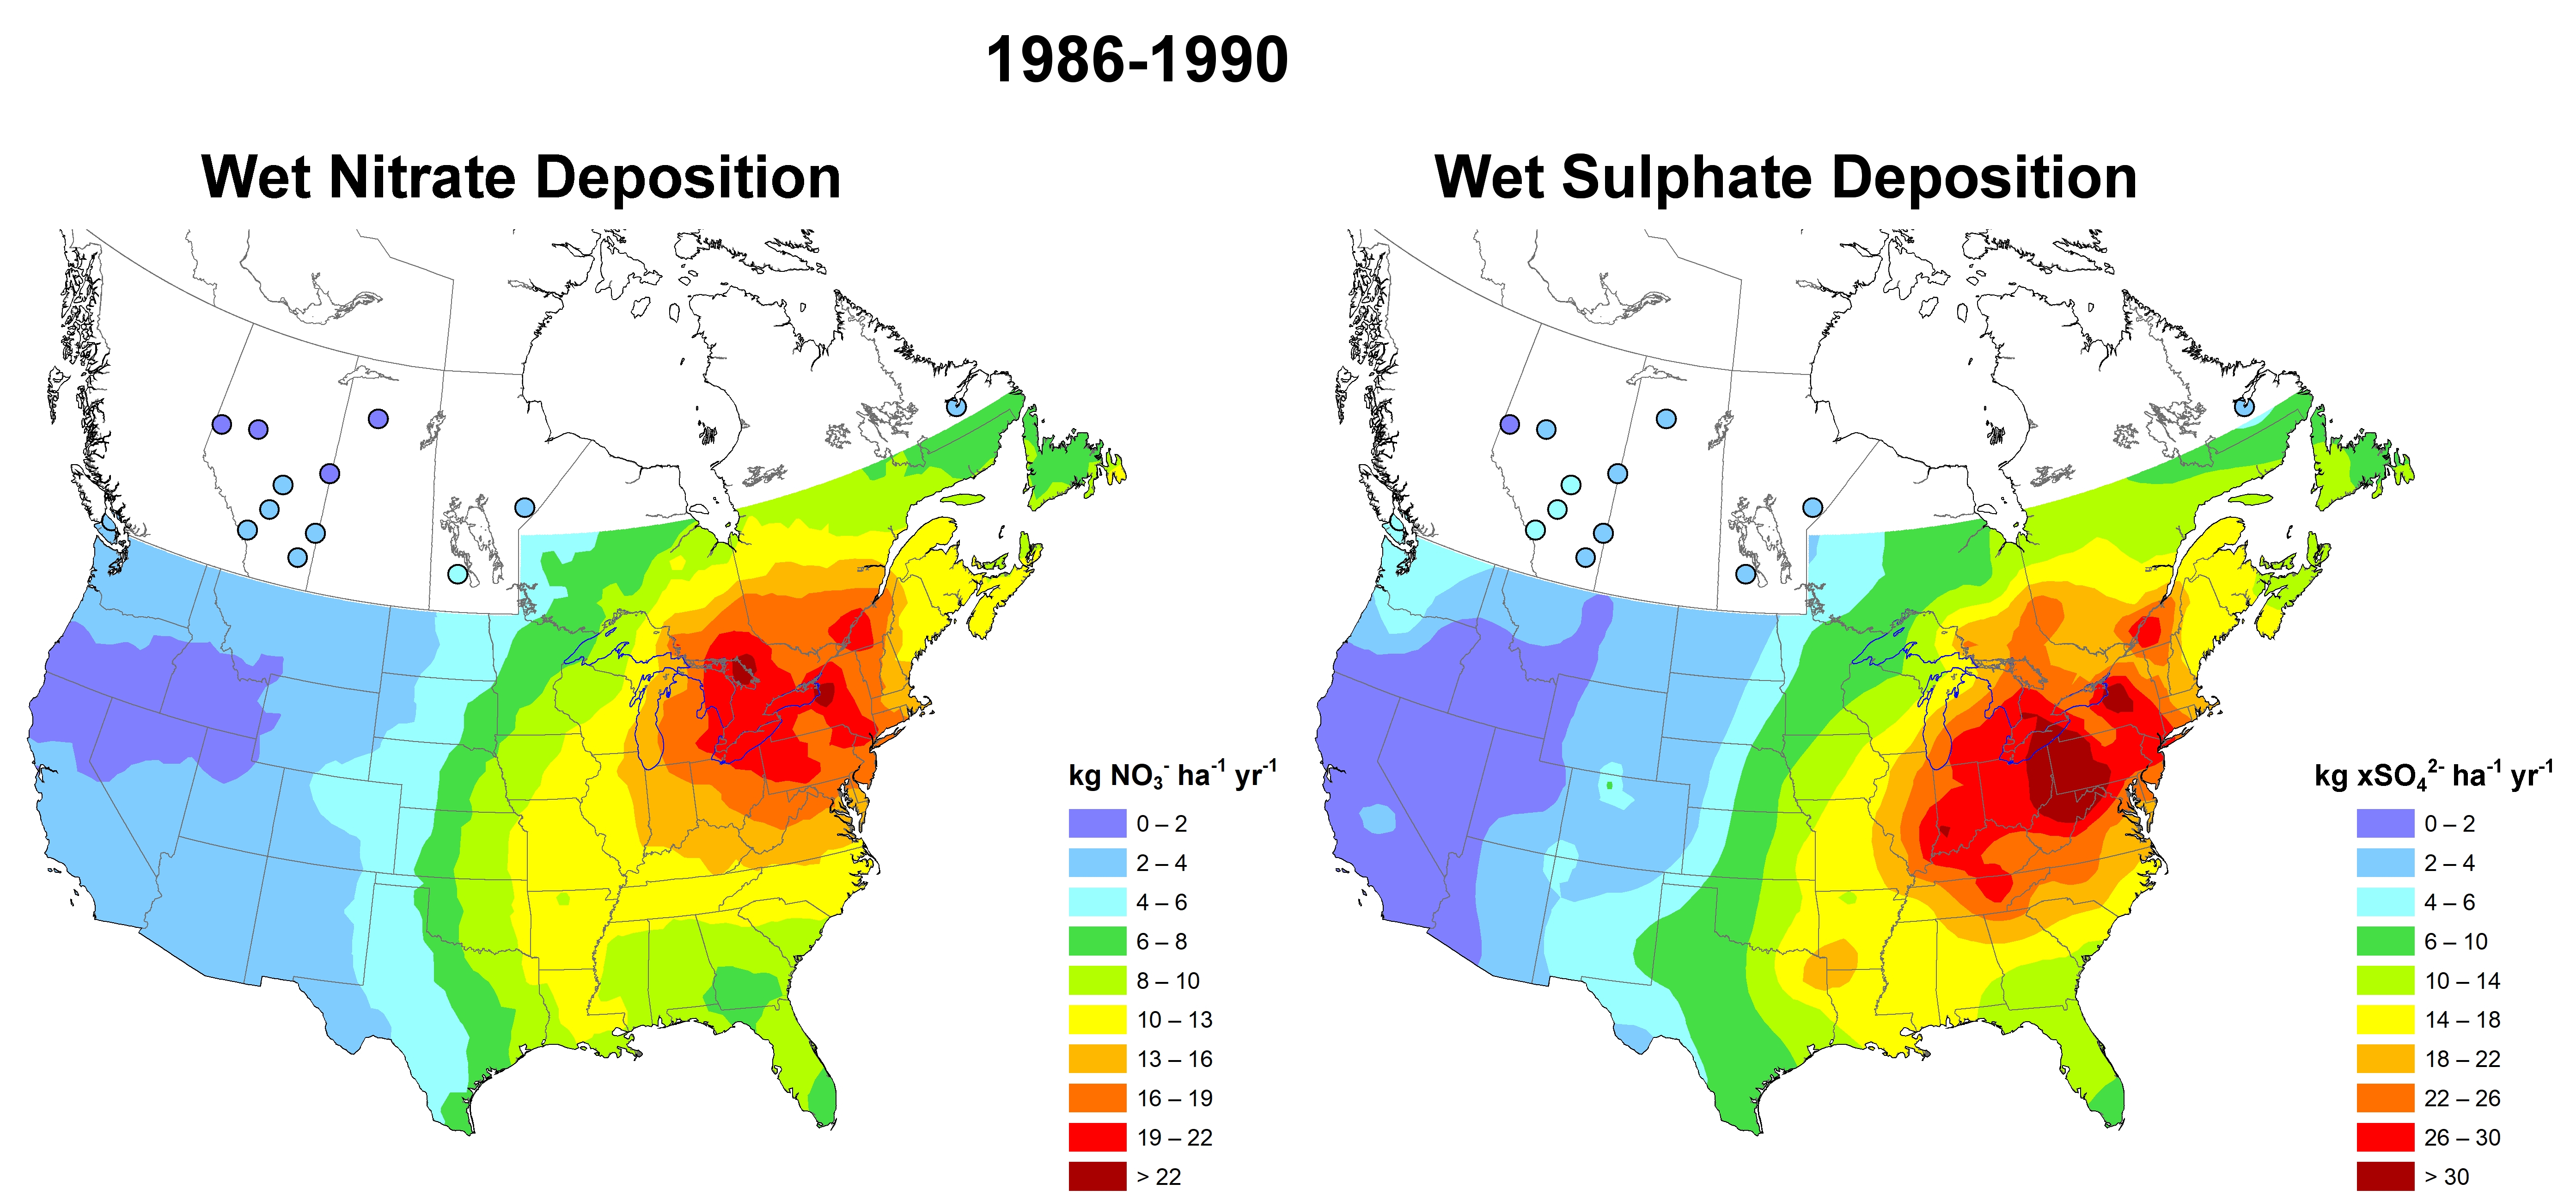
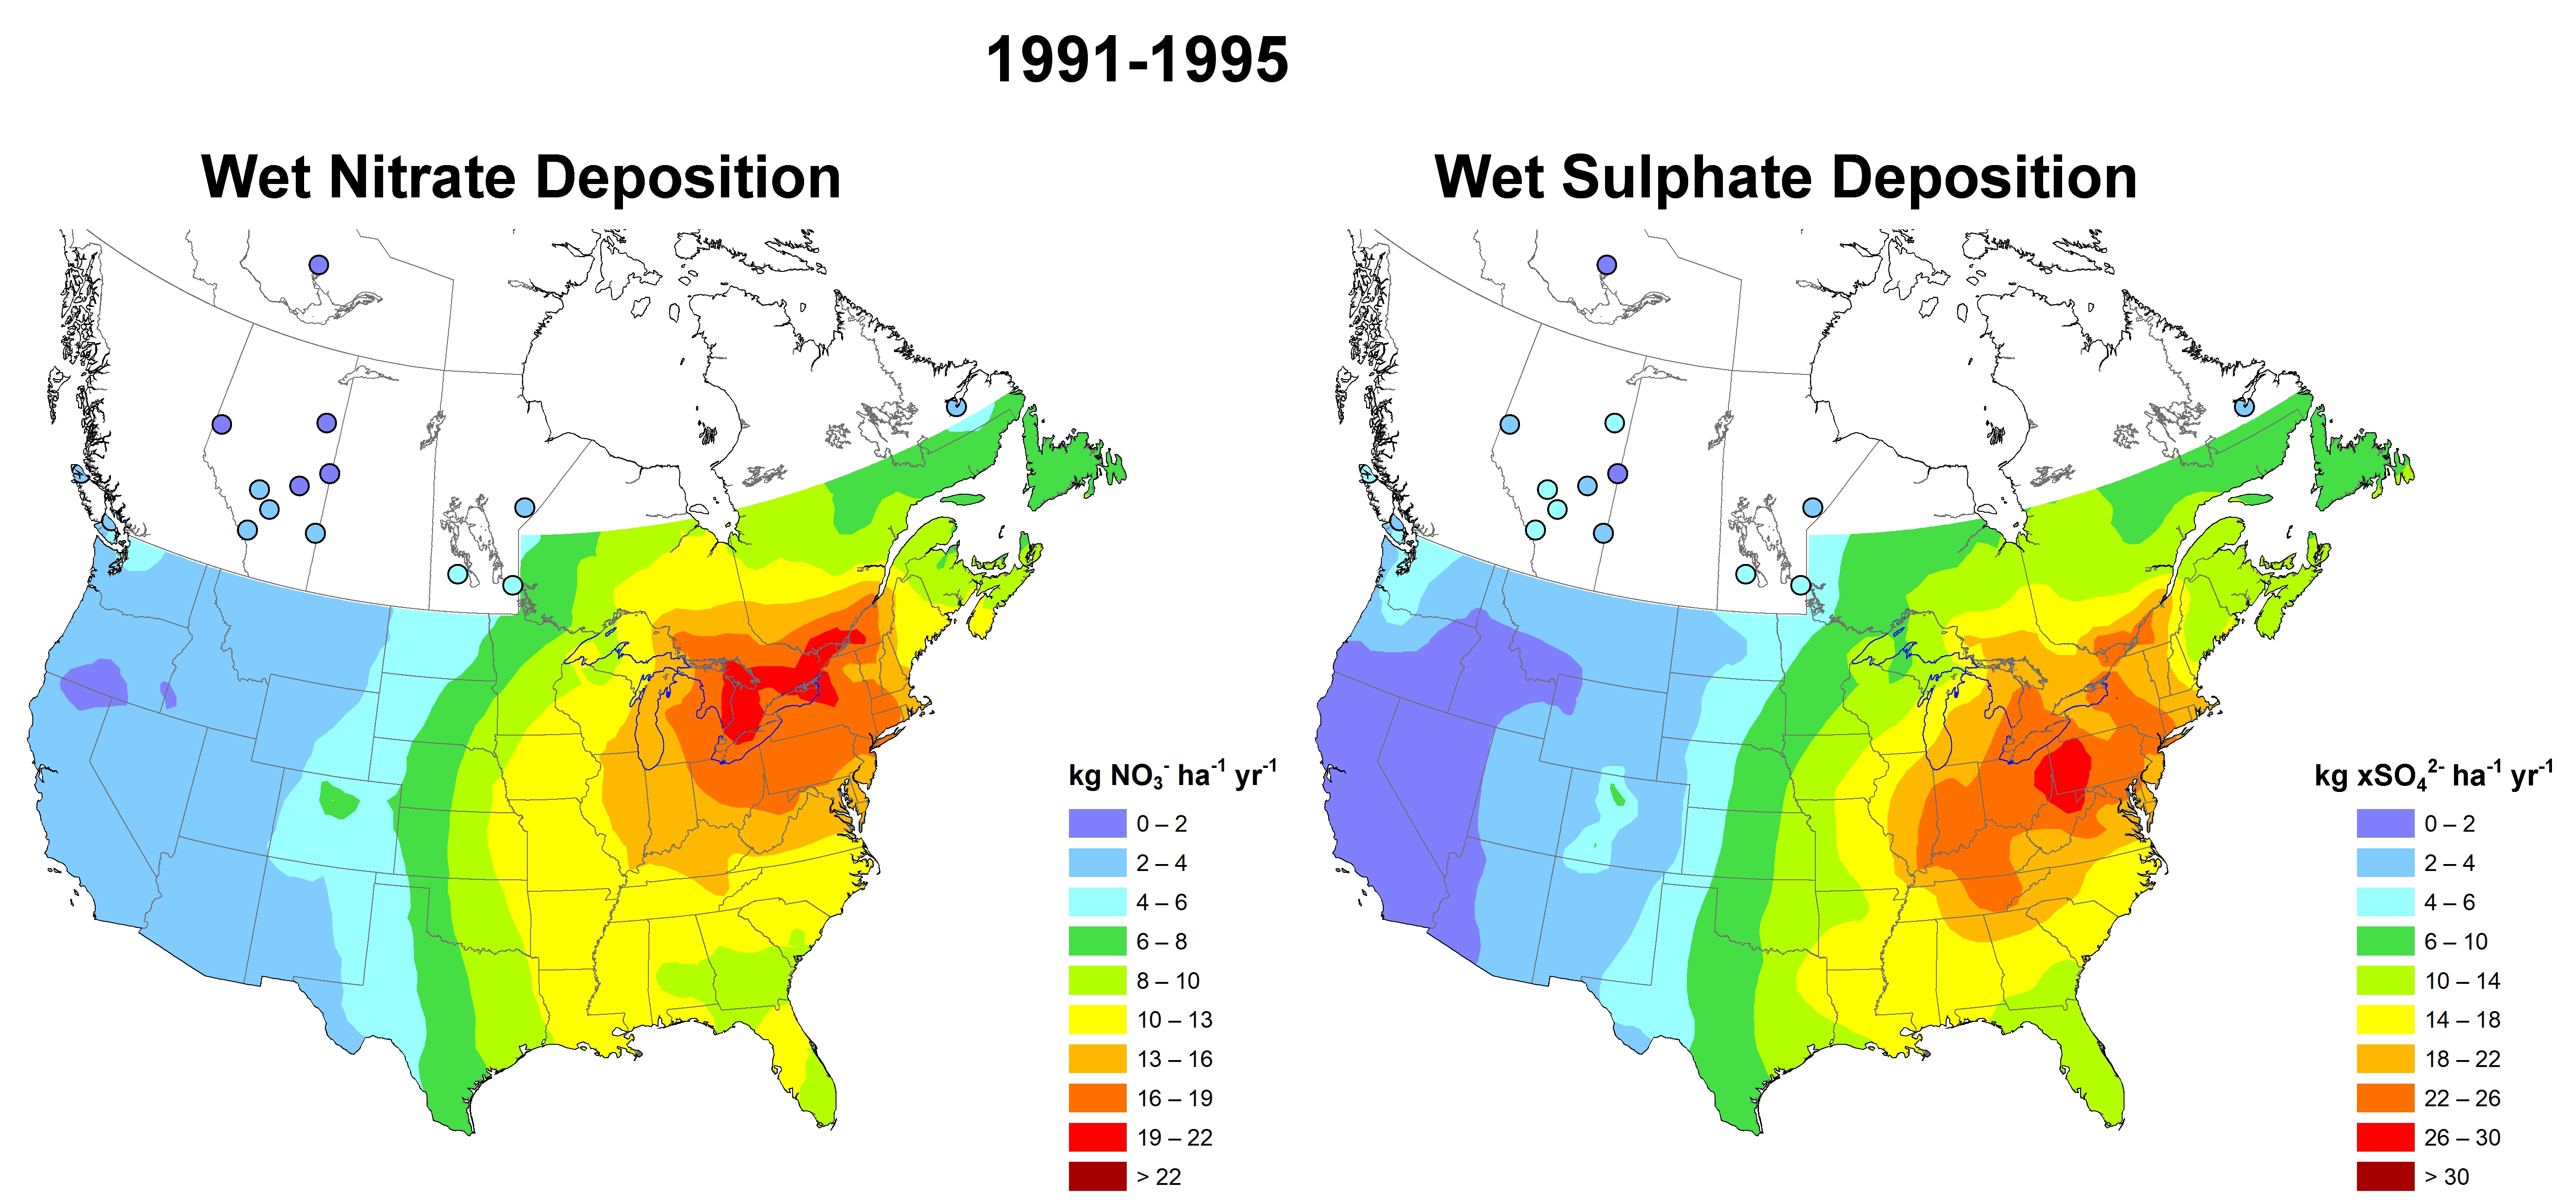
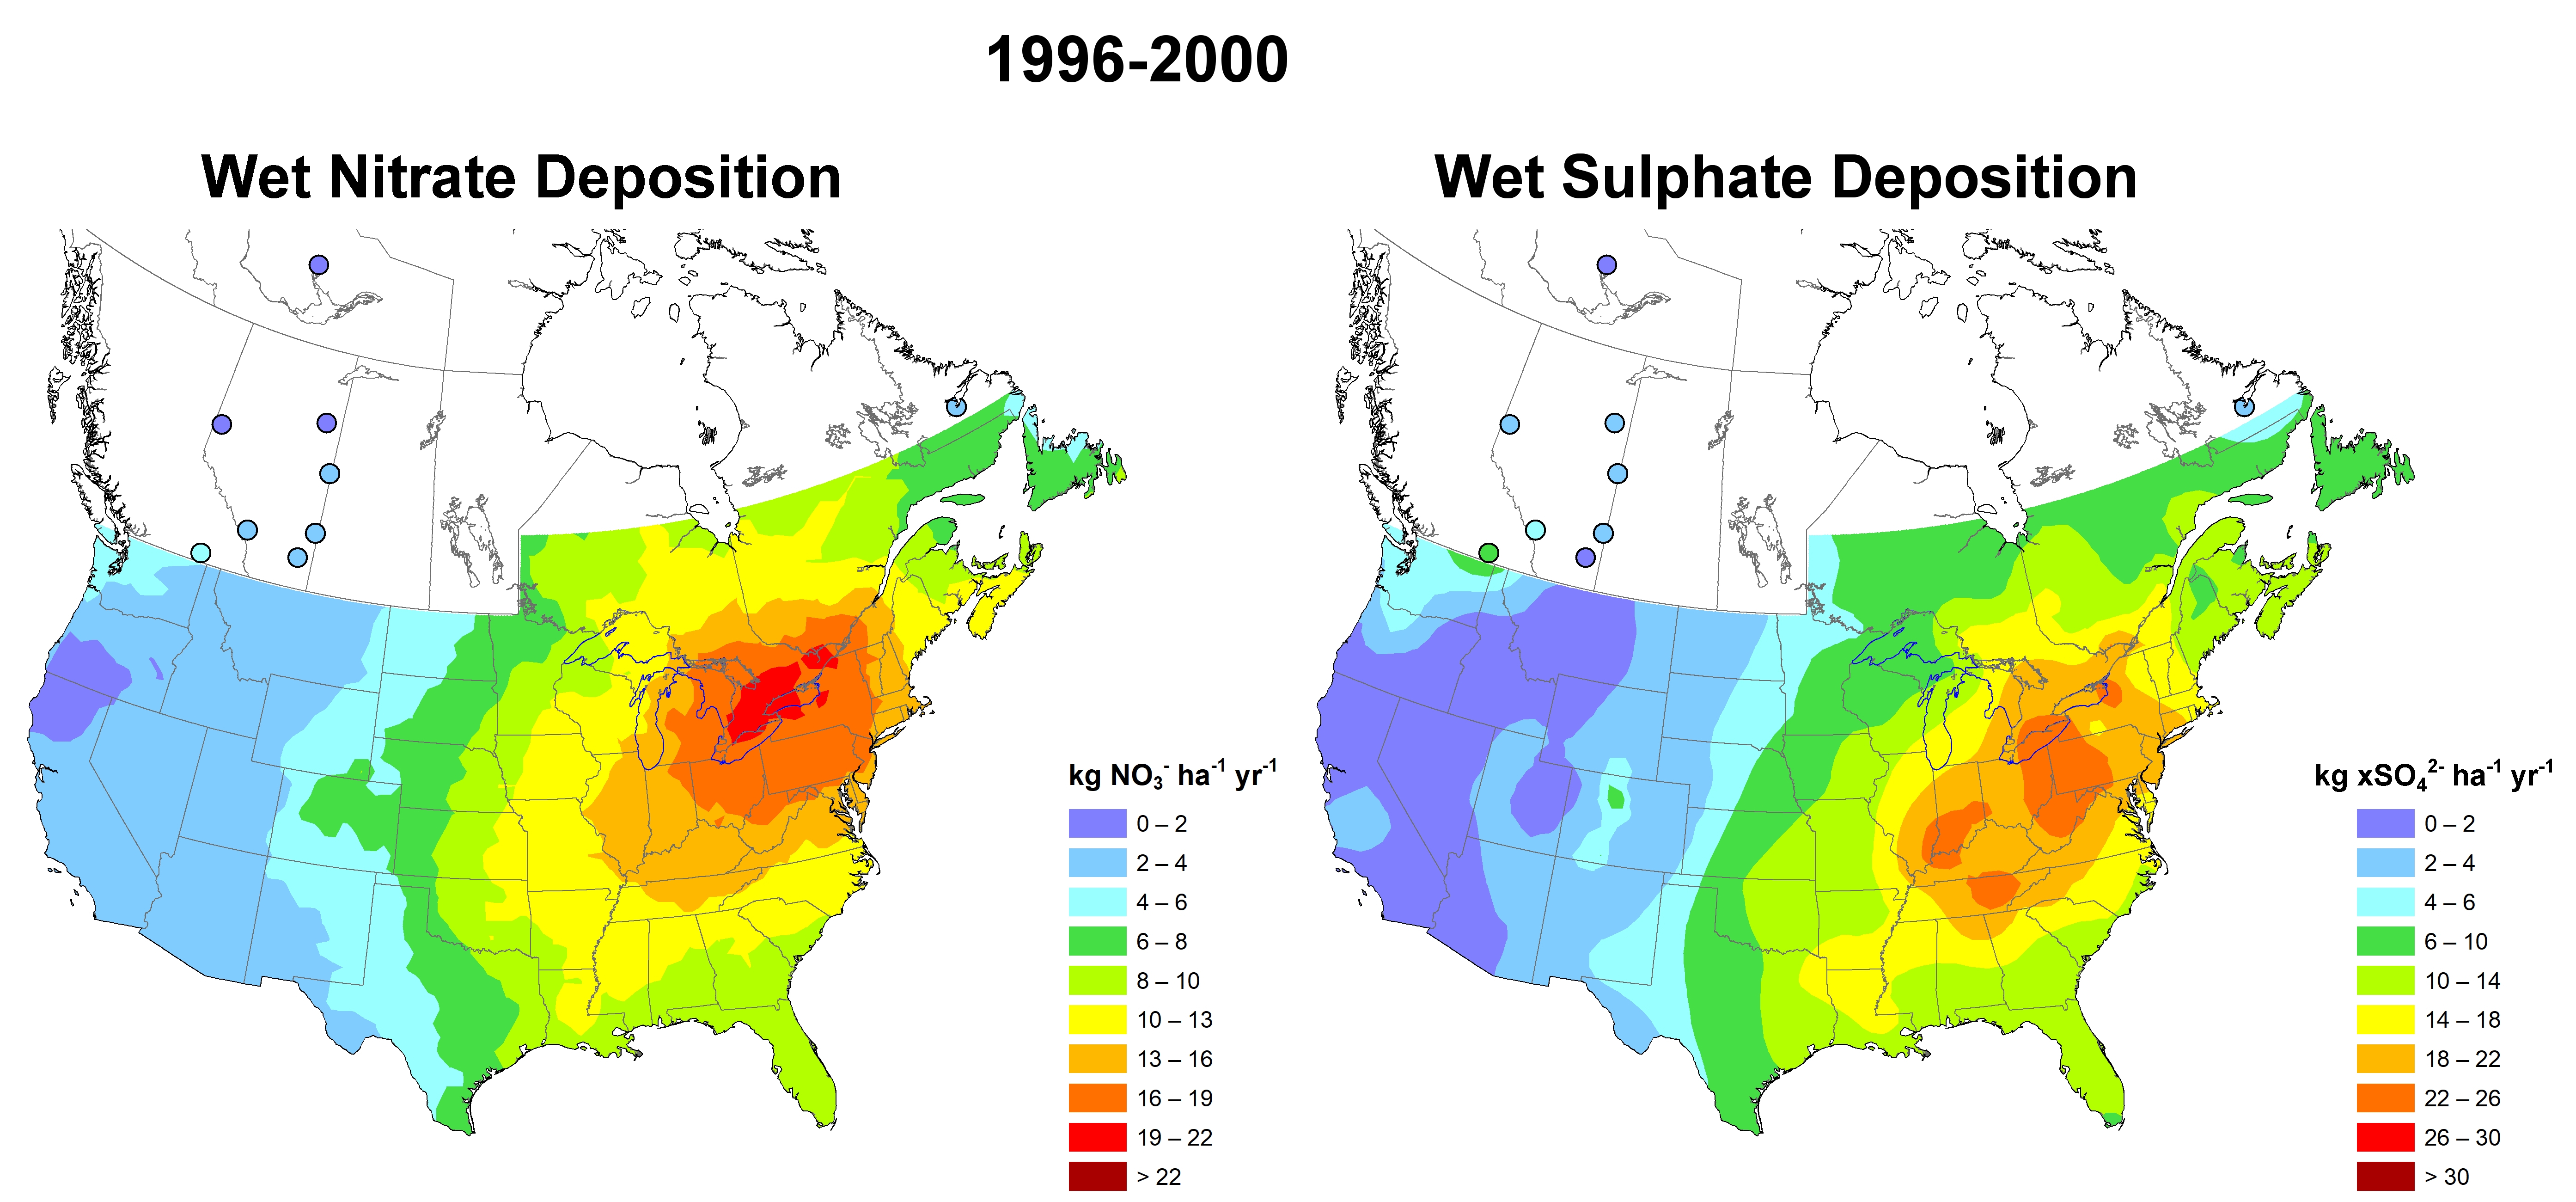
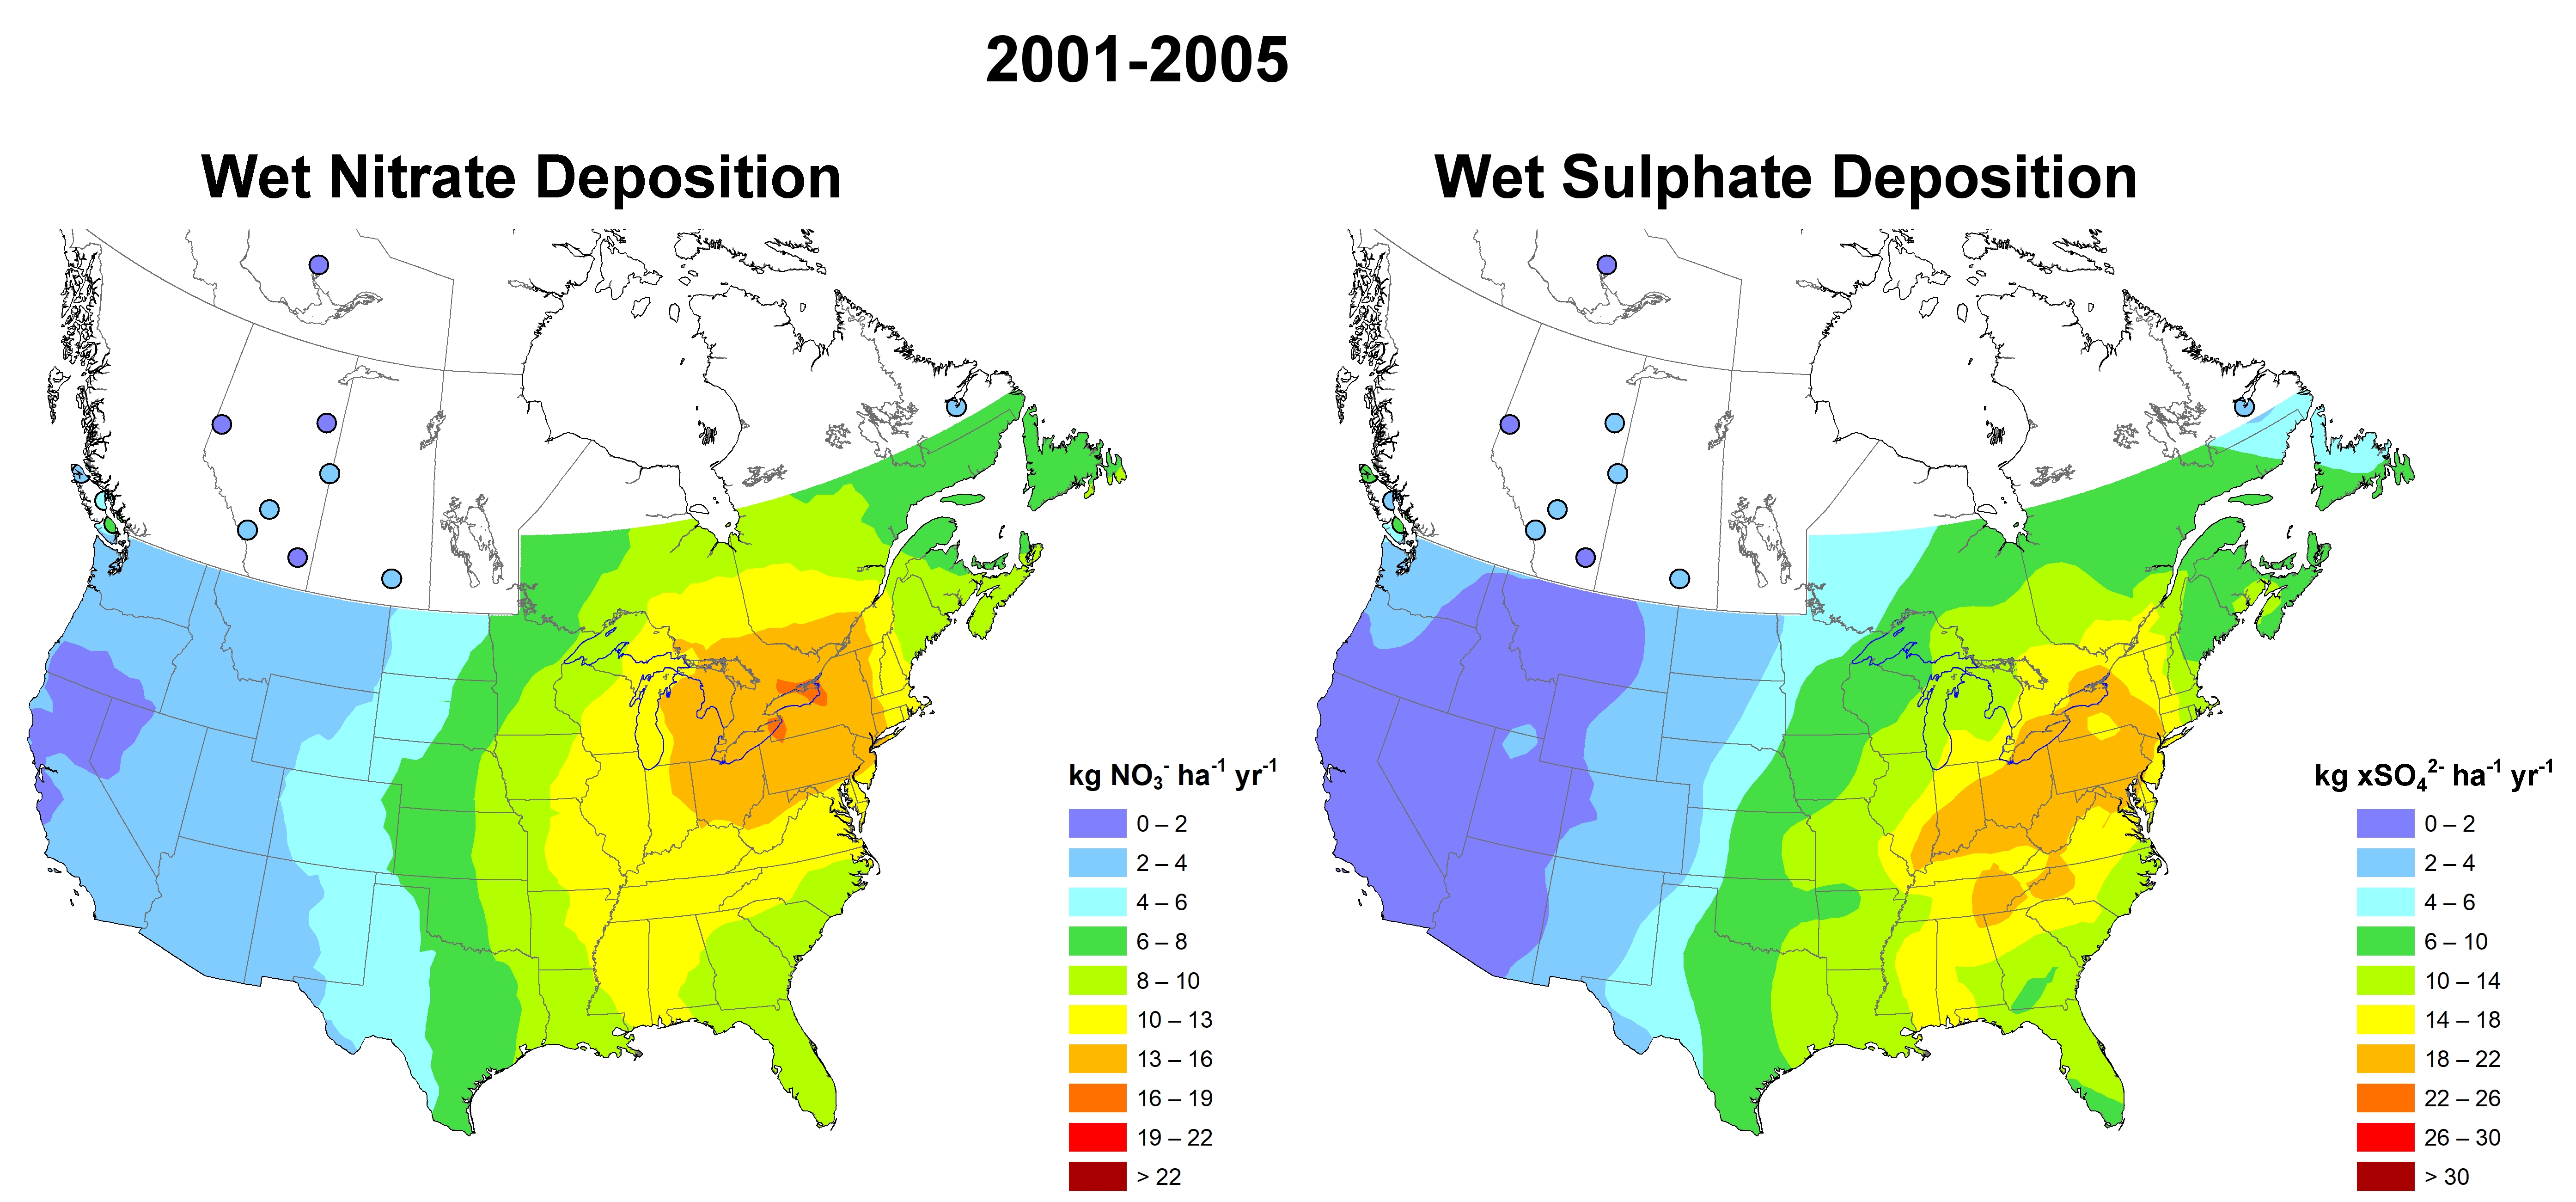
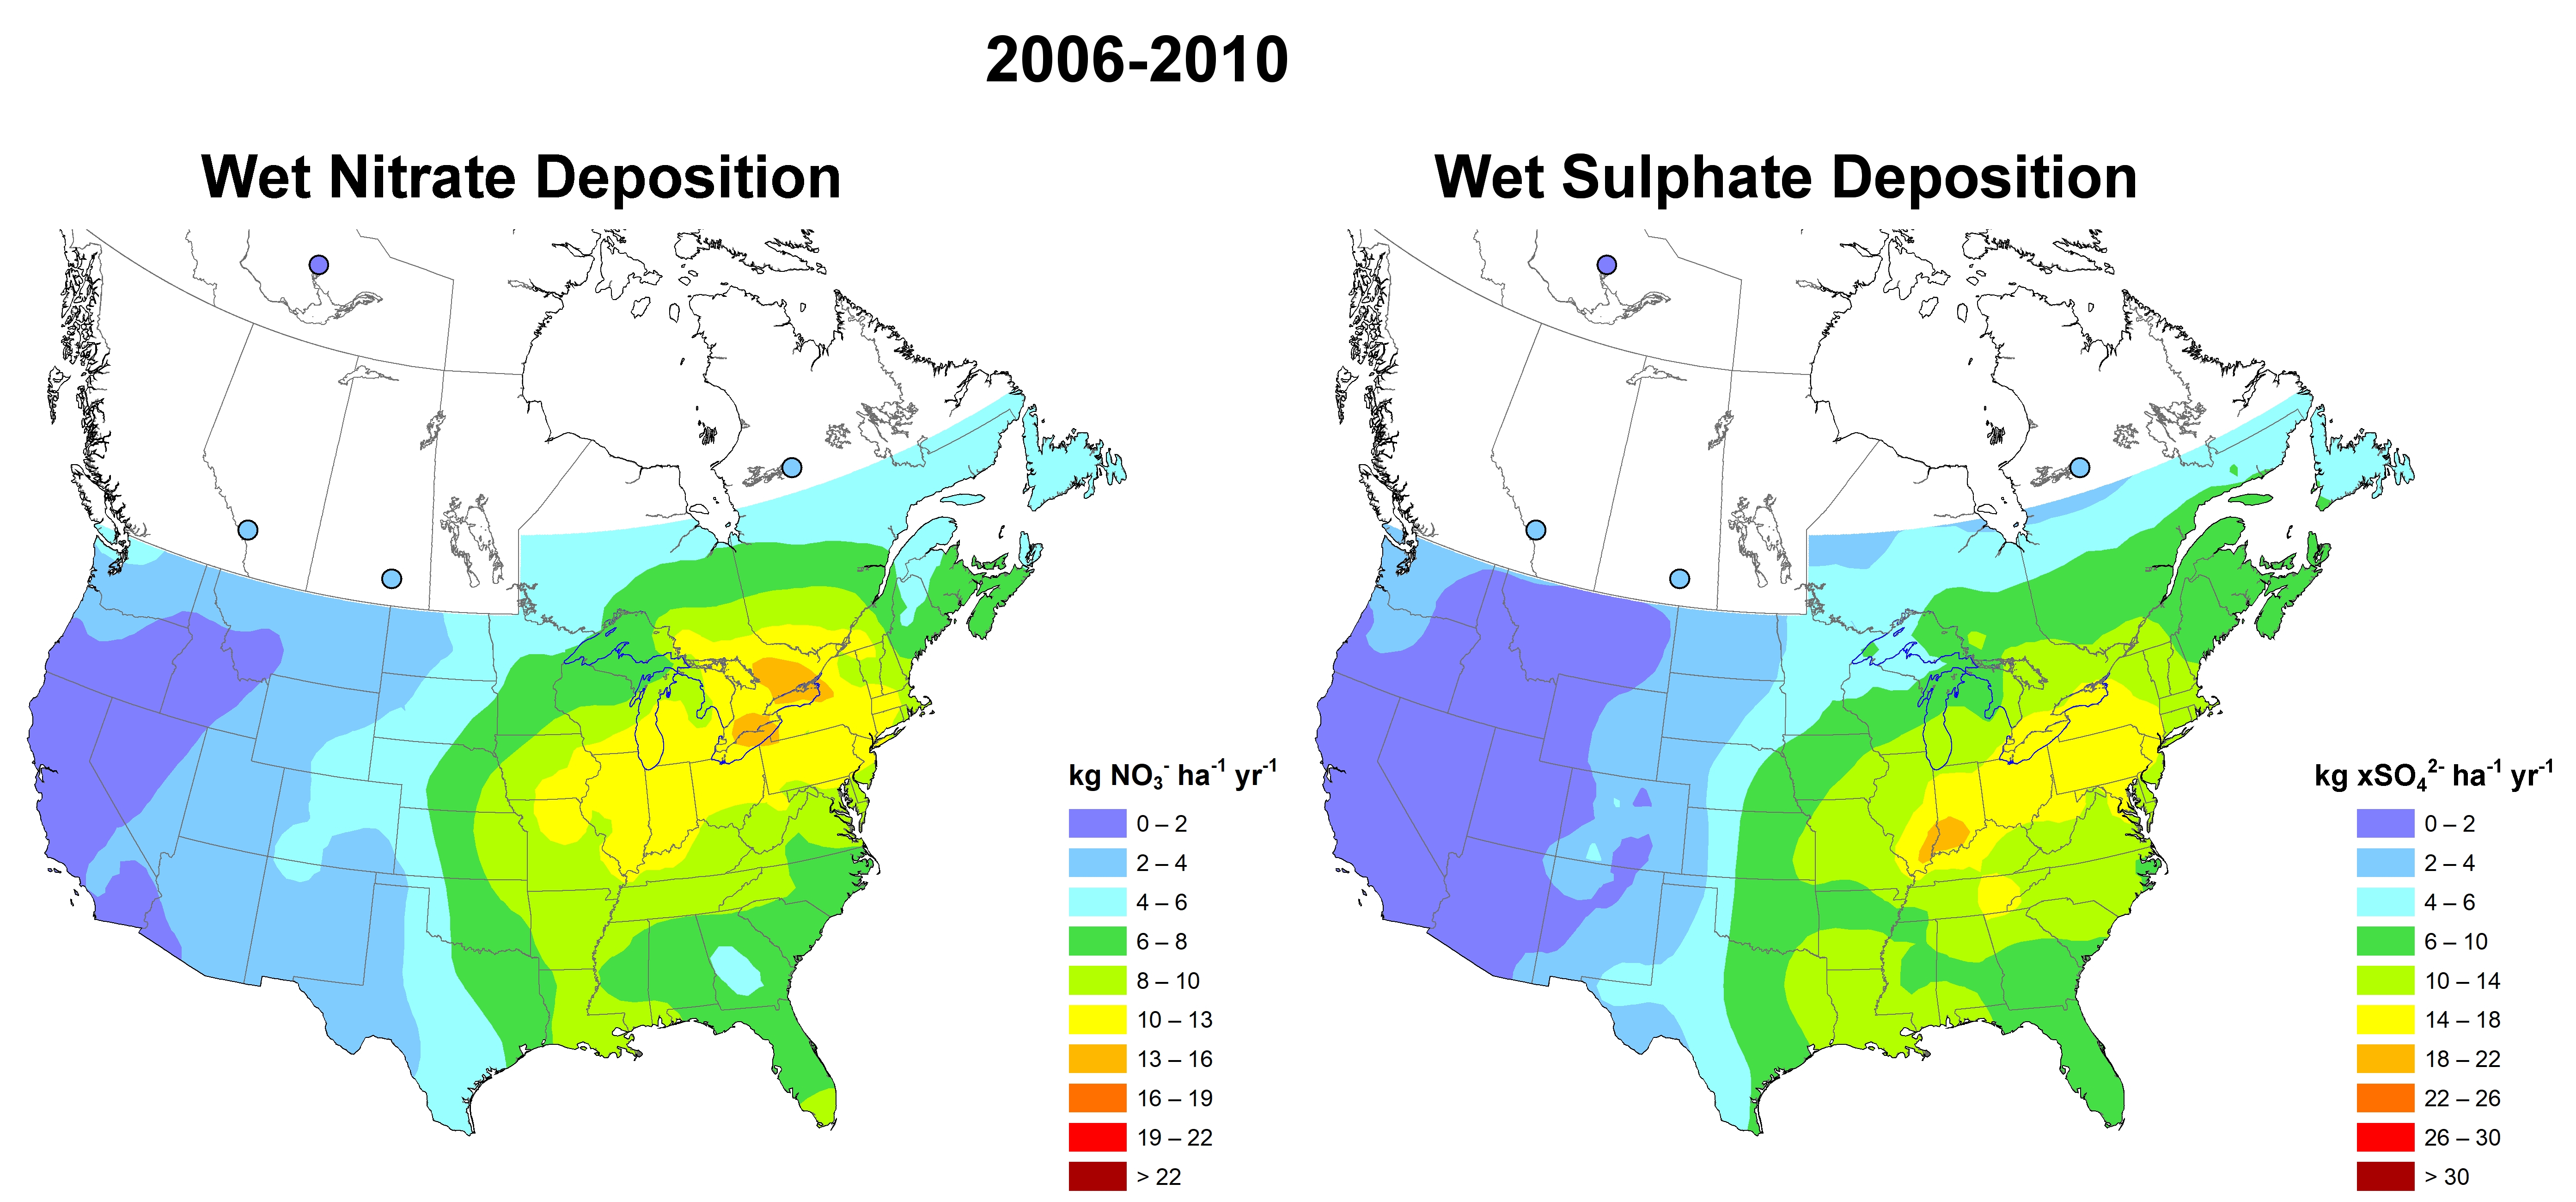
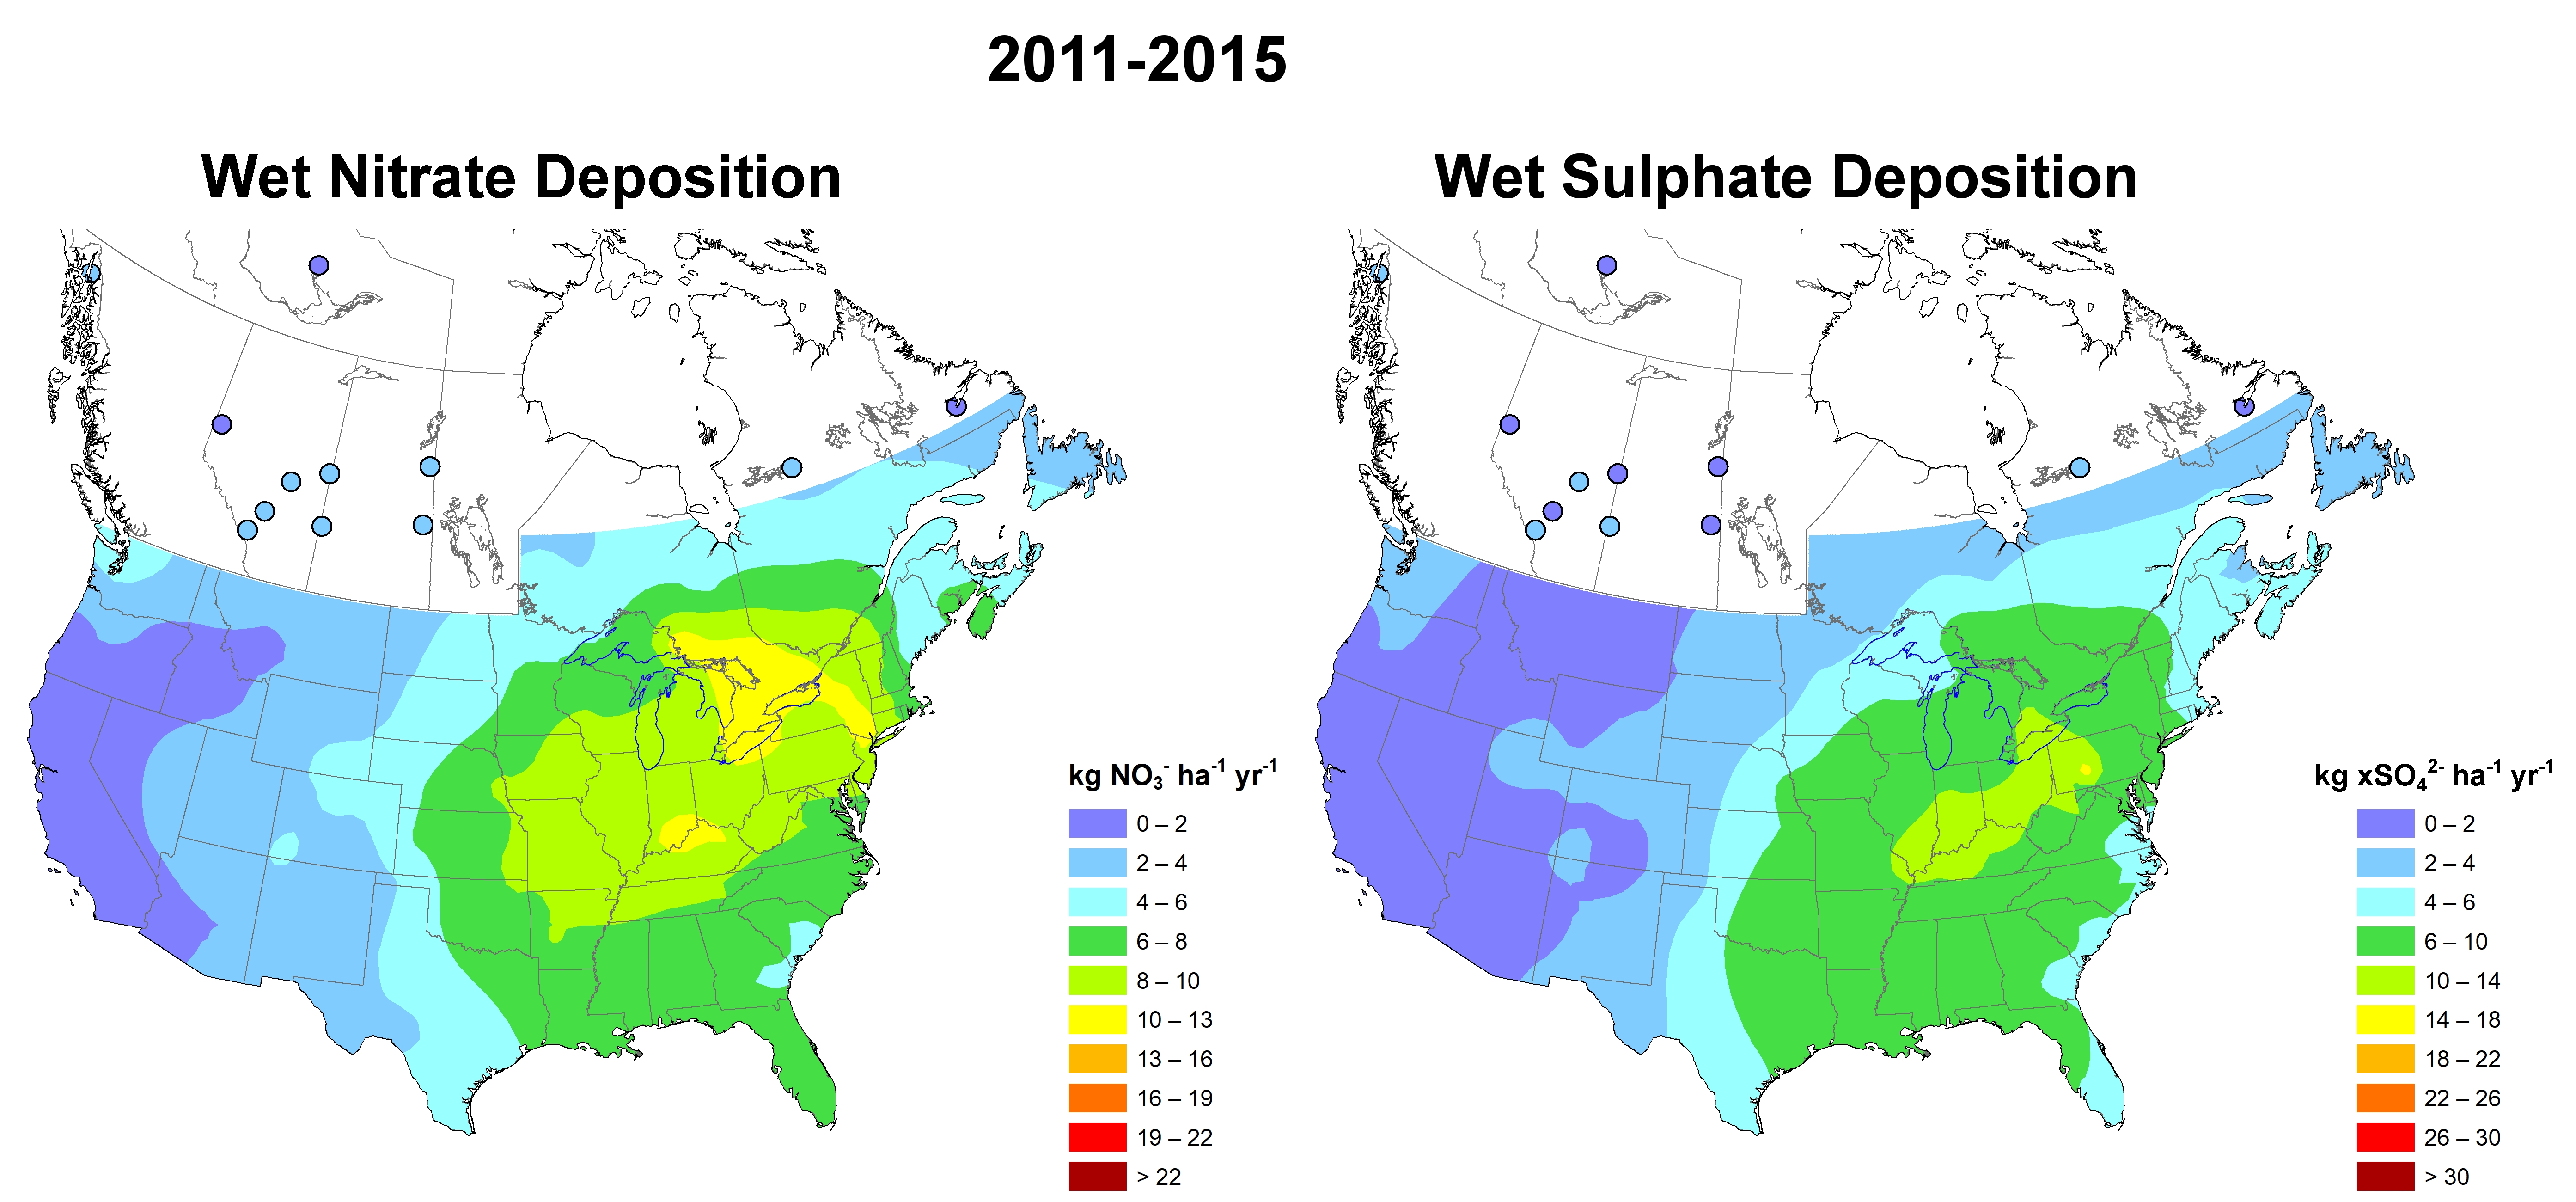
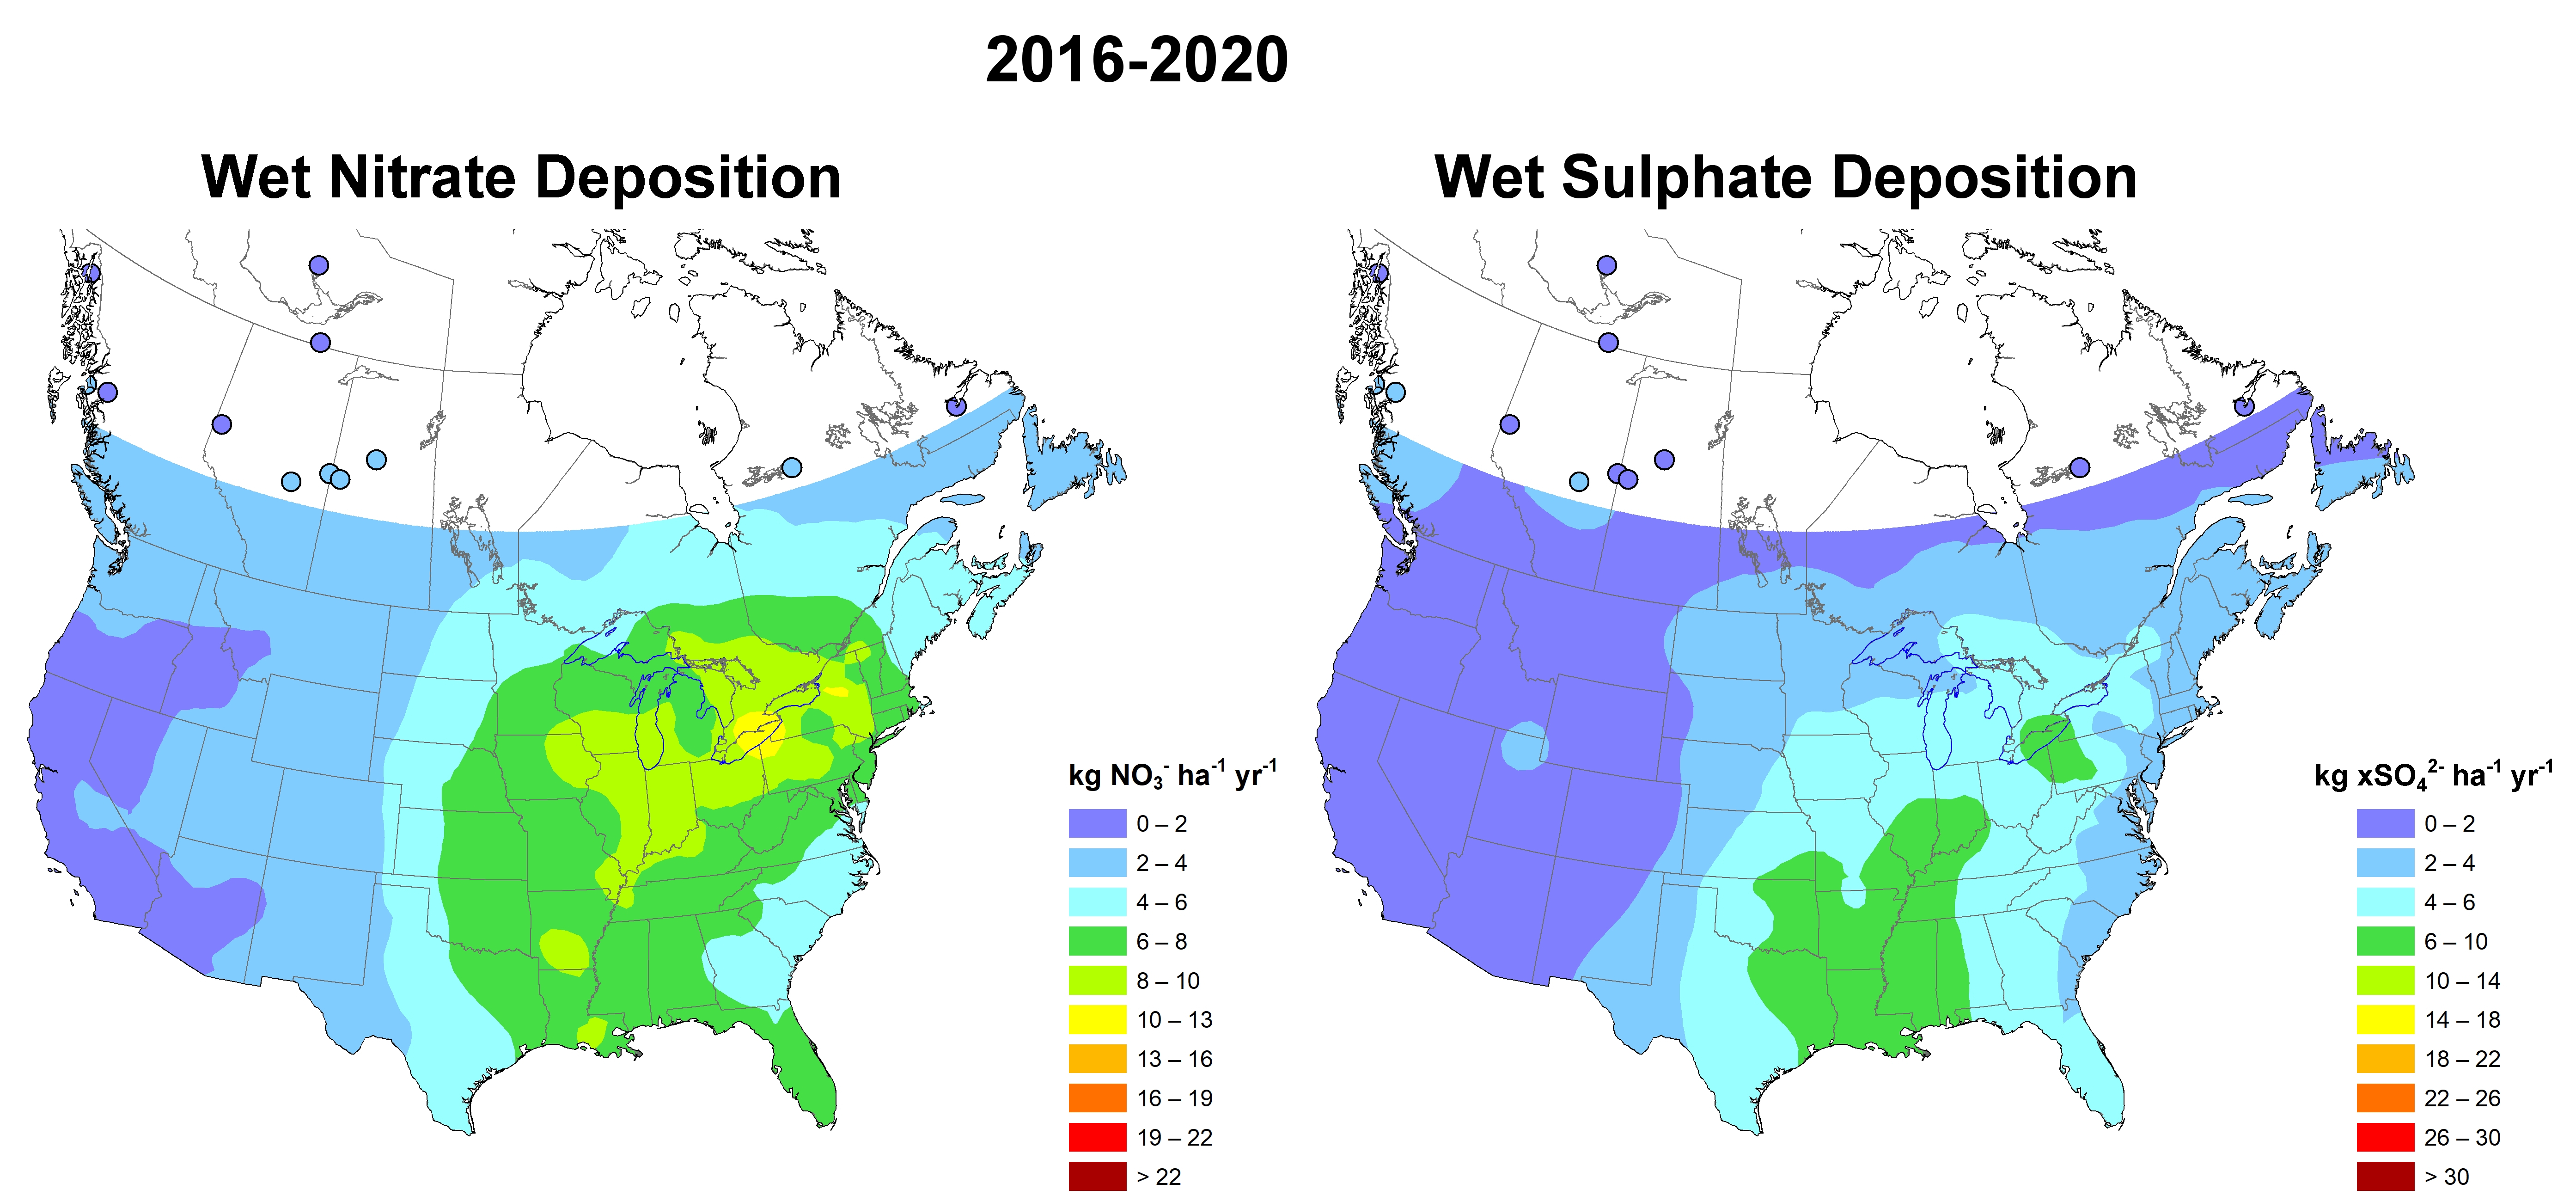
Nitrogen dioxide (NO2) belongs to the oxides of nitrogen group of compounds (NOx) that are formed primarily through the burning of fossil fuels. While transportation sources represent over half of all emissions, energy production and industrial processes also emit significant amounts of NOx, mainly as Nitric Oxide (NO) and Nitrogen dioxide (NO2). NO2 at higher concentrations has a strong, harsh odour and can typically be seen over large cities as a brownish haze. Once formed, NO2 can combine with water molecules in the air to form compounds like nitric acid and nitrous acid. Ultimately, these compounds fall to earth through precipitation (such as rain, snow and fog) where they contribute to the acidification and eutrophication of ecosystems.

Sulphur dioxide (SO2)

Sulphur dioxide (SO2) is a colourless gas that smells like burnt matches. It belongs to a group of sulphur-containing gases called sulphur oxides (SOx). SO2 is emitted when fossil fuels or raw materials containing sulphur are burned or used in an industrial process like metal ore smelting or electric power generation. It can also be produced in large quantities during extraction and processing of fossil fuels. SO2 contributes to the formation of PM2.5 and smog, and when combined with water molecules in the air, it can form compounds like sulfuric acid, which eventually falls to earth as acid rain, snow and fog.

Volatile Organic Compounds (VOCs)

Volatile organic compounds (VOCs) are organic chemicals that easily turn to vapour under normal atmospheric conditions. When VOCs are exposed to sunlight, complex chemical reactions occur with NOx that lead to the production of O3 and fine particulate matter (PM2.5), two key components of smog. Smog is known to have adverse effects on human health and the environment. VOCs cover a wide range of chemicals including fumes from oil-based paint, household cleaning products, solvents and gasoline, as well as from some natural sources. Across Canada, the main human-related sources are related to the extraction of oil and gas, the use of paints and solvents, transportation, and home firewood burning.

Learn the difference between pollutant emissions and ambient concentrations:

Air emissions

Air emissions refer to the release of pollutants into the atmosphere from a source. A “source” can include industrial facilities, various types of transportation, home heating appliances and much more. Air emissions also come from natural sources, like forest fires and volcanoes. The quantity of emissions released from human activities vary depending on a number of factors, such as: changes in industrial output and processes, fuel types, pollutant reduction technologies and the economy.

Ambient concentrations

Ambient air concentrations refer to the amount of pollutants in a defined volume of air. These are usually expressed in parts per billion by volume (ppb) for gases and in micrograms per meter cubed for particulate matter. Ambient air quality reporting only considers outdoor air, with air monitoring stations located mostly in, or near, large communities where exposure takes place. Ambient air concentrations reflect and respond to changes in the quantity of emissions released and to changes in meteorology (wind speed, wind direction, temperature, precipitation, etc.).
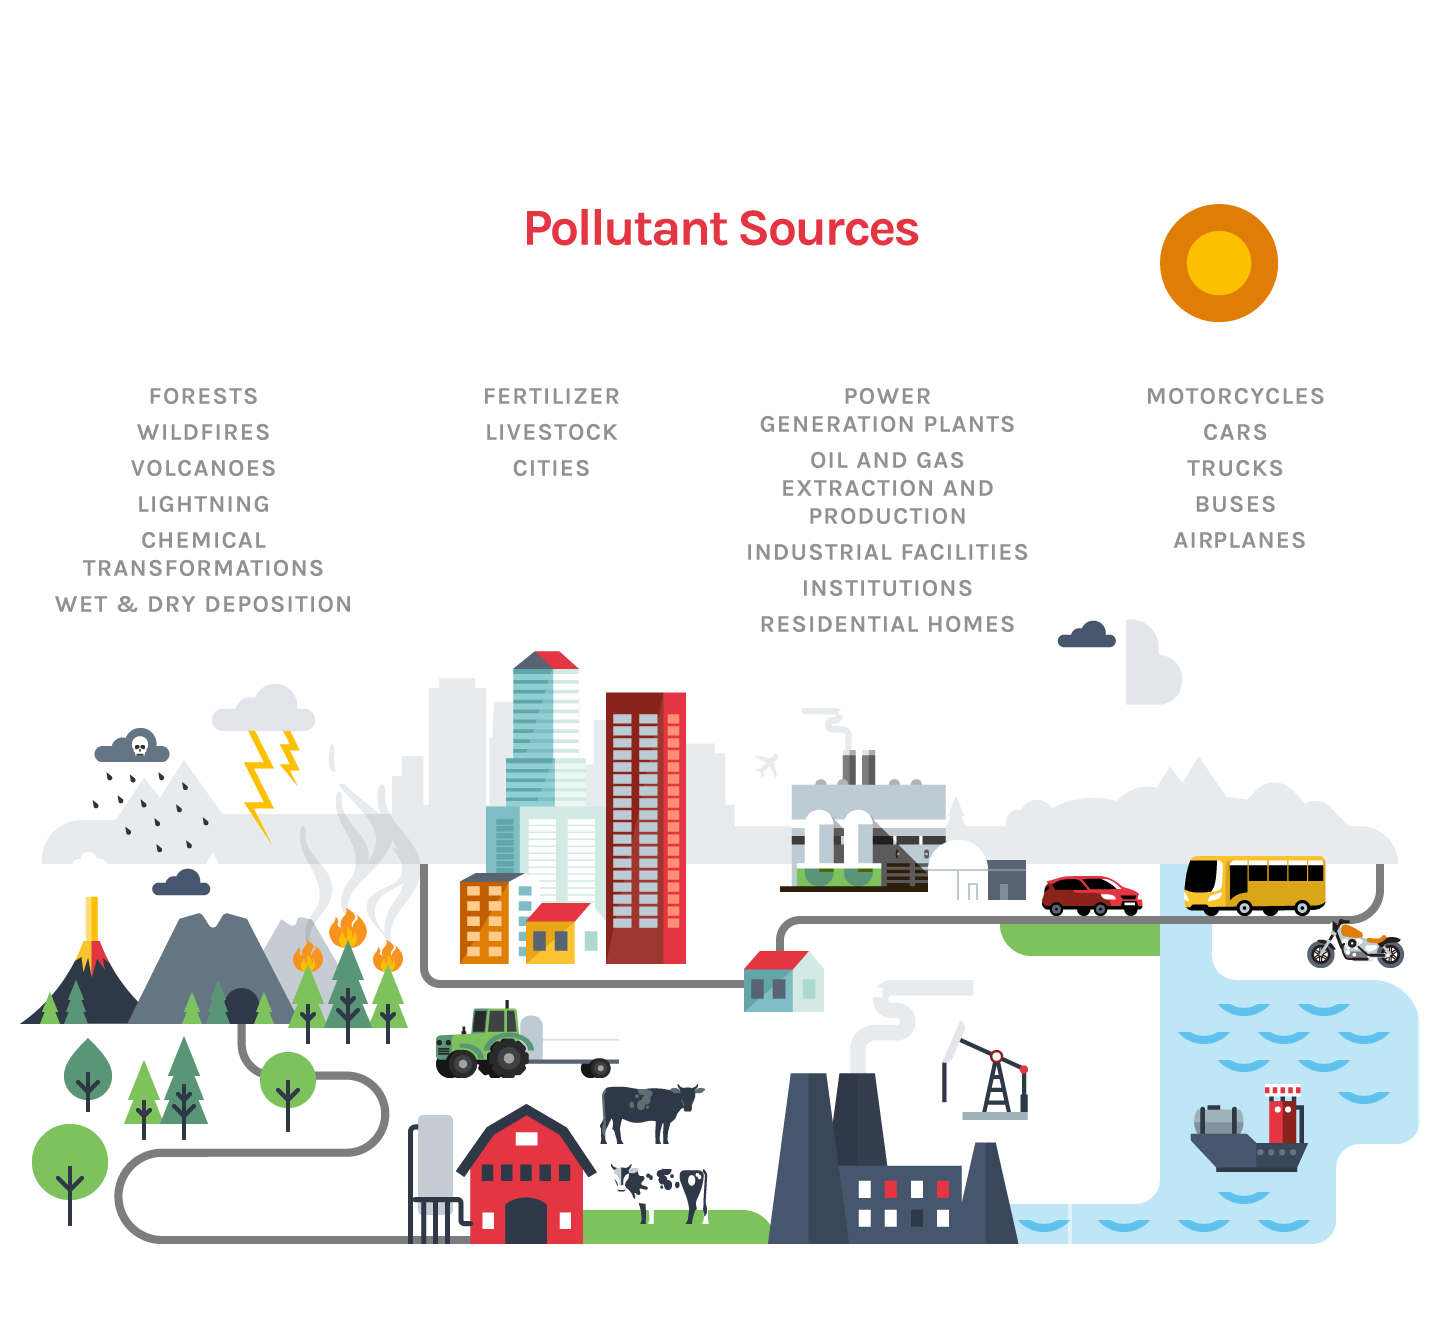
Pollutant Sources

  • FORESTS
  • WILDFIRES
  • VOLCANOES
  • LIGHTNING
  • CHEMICAL
  • TRANSFORMATIONS
  • WET & DRY DEPOSITION
  • FERTILIZER
  • LIVESTOCK
  • CITIES
  • POWER
  • GENERATION PLANTS
  • OIL AND GAS EXTRACTION AND PRODUCTION
  • INDUSTRIAL FACILITIES
  • INSTITUTIONS
  • RESIDENTIAL HOMES
  • MOTORCYCLES
  • CARS
  • TRUCKS
  • BUSES
  • AIRPLANES

Effects on Human Health and the Environment

According to the World Health Organization (WHO) air pollution represents the biggest environmental risk to human health and can severely affect the environment. Even at low levels, air pollution has been clearly linked to increased heart and breathing problems, increased hospitalization and emergency room visits and premature death. Health Canada estimates that air pollution in 2018 contributed to about 17,400 premature deaths in Canada, as well as many non-fatal impacts, with a total economic cost of $146 billion.

Improved air quality reduces heart attacks and hospital visits, avoids hundreds of thousands of child asthma attacks, and prevents millions of lost school and work days in Canada alone. Cleaner air can also reduce damage to crops, forests, surface waters, and infrastructure such as buildings and bridges, and can help address climate change impacts since some air pollutants are also greenhouse gases or contribute to the formation of greenhouse gases.

Source: Health Canada, 2024. Health Impacts of Air Pollution in Canada in 2018 – 2024 Report.

Fine Particulate Matter (PM2.5)

Health Effects - Short-term exposure to PM2.5 can cause serious heart and lung outcomes like heart attacks, heart failure, stroke, and asthma attacks, as well as premature death. It can also result in hospital visits for cardiovascular and respiratory problems. Long-term exposure to PM2.5 can cause premature death, and likely causes lung cancer and heart and lung diseases. There is limited evidence that long-term exposure to PM2.5 may also cause neurological and developmental outcomes. Any level of exposure to PM2.5 poses a risk to population health. Children, older adults, smokers, and people with underlying cardiovascular and respiratory disease (e.g., asthma) are at greater risk.

Environmental Effects - The impacts of PM2.5 on the environment can vary depending on its chemical make-up. For instance, PM2.5 often contains acidifying components that can cause changes to soil and water chemistry and may contain heavy metals or other toxic substances. These components can adversely impact animals and vegetation, leading to species and habitat loss. Other components in PM2.5 may have a neutralizing effect on acidity. Deposition of PM2.5 on leaves can reduce photosynthesis rates, decrease agricultural crop yields, and may change the absorption rate of other chemicals such as SO2. PM2.5 can stain and damage stone and other materials, impacting buildings, statues, and monuments. PM2.5 also contributes to reduced visibility, which affects cities, airports, and wilderness areas, and can negatively impact tourism and the economy.

Ozone (O3)

Health Effects - Short-term exposure to O3 causes a range of respiratory symptoms and likely causes premature death. Some respiratory symptoms, like shortness of breath, airway injury, and reduced lung function, can result in hospital visits. There is limited evidence that short term O3 exposure may also cause adverse cardiovascular outcomes, and that long-term exposure may cause changes in lung function in children, asthma development, respiratory mortality, and structural changes in the lungs. Any level of exposure to O3 poses a risk to population health. Children, older adults, and people with underlying respiratory disease (e.g., asthma) are at greater risk.

Environmental Effects - O3 is absorbed directly by plants through pores in their leaves. Once inside the plant, ozone can damage leaves, reduce photosynthesis rates, impair reproduction and decrease agricultural crop yields. This can reduce the variety of plants in an ecosystem and may contribute to forest decline in some parts of Canada. O3 exposure is also known to degrade plastics. While mostly known for its adverse effects on health and the environment, O3 is also a greenhouse gas that contributes to climate change.

Nitrogen dioxide (NO2)

Health Effects - Short-term exposure to NO2 can cause adverse respiratory effects including reduced lung function, increased symptoms, and airway inflammation. It exacerbates respiratory diseases, such as asthma and chronic obstructive pulmonary disease (COPD) and likely causes premature death. Long-term exposure to NO2 likely causes adverse respiratory effects, and there is limited evidence that it may also cause cardiovascular, reproductive, and developmental effects as well as cancer and premature death. Any level of exposure to NO2 poses a risk to population health. Children, older adults and people with underlying respiratory conditions (e.g., asthma and COPD) are at greater risk.

Environmental Effects - Direct exposure to NO2, through absorption by leaves, can lead to lesions and dead tissue in plants, and to altered plant growth and yield. NO2 (and other nitrogen oxides) may also react to produce other chemicals that impact the environment. These reactions include those with water and oxygen to form acid rain, which negatively affects soil and water. Other reactions produce an overabundance of nitrogen-based nutrients that adversely affect an ecosystem, such as through overgrowth of algae and plants in water bodies. NO2 also contributes to the formation of PM2.5 and O3 and to reduced visibility, which affects cities, airports, and wilderness areas, and can negatively impact tourism and the economy.

Sulphur dioxide (SO2)

Health Effects - Short-term exposure to SO2 affects respiratory health, resulting in reduced lung function, increased respiratory symptoms, and airway inflammation. Effects can include increased hospital visits for respiratory causes. There is limited evidence that short-term exposure may also cause premature mortality, particularly in older adults. Children and people with underlying respiratory disease (e.g., asthma) are at a greater risk.

Environmental Effects - Direct exposure to SO2, through absorption by leaves, can harm plants by interfering with photosynthesis and energy metabolism, and can cause decreased plant growth and yield. SO2 may also react in the atmosphere or on surfaces to create sulphuric acid. Within the atmosphere, this quickly forms particulate sulphate (a component of PM2.5). The deposition of SO2 onto surfaces, through dry deposition or acid rain, may result in surface acidification, which can damage materials and structures, including objects of cultural importance like statues and monuments.

Volatile Organic Compounds (VOCs)

Health Effects - The health effects of individual VOCs depend on the chemical, and the level and duration of exposure. While some VOCs give off distinctive odours at higher levels, some are odourless. Many VOCs have little effect on health at levels typically measured outdoors. The health effects of individual VOCs can include irritation (eye, nose and throat), headaches, nausea, dizziness, fatigue, breathing problems and neurological effects. Long-term exposure to some VOCs, like benzene, can increase the risk of developing cancer. Children, older adults, pregnant people, and people with underlying health conditions (e.g., asthma or bronchitis) are at greater risk.

Environmental Effects - VOCs contribute to the formation of PM2.5 and O3, which are the main components of smog. Emitted as volatile gases, these chemicals react within the atmosphere that can result in the formation of organic aerosol (a component of PM2.5). Reactions of VOCs may also result in the formation of highly reactive chemicals, which may alter the concentration of NO2 and increase the formation of O3.

CAAQS

CCME developed Canadian Ambient Air Quality Standards (CAAQS) for PM2.5, O3, SO2 and NO2. All CAAQS consist of three interrelated elements:

  • an averaging time period
  • a numerical value
  • the statistical form of the numerical standard.
Pollutant Averaging Time Numerical Value Statistical Form
2015 2020 2025
Fine Particulate Matter (PM2.5) 24-hour 28 μg/m3 27 μg/m3   The 3-year average of the annual 98th percentile of the daily 24-hour average concentrations
Annual 10.0 μg/m3 8.8 μg/m3   The 3-year average of the annual average of the daily 24-hour average concentrations
Ozone (O3) 8-hour 63 ppb 62 ppb 60 ppb The 3-year average of the annual 4th highest of the daily maximum 8-hour average ozone concentrations
Nitrogen dioxide (NO2) 1-hour - 60 ppb 42 ppb

The 3-year average of the annual 98th percentile of the daily maximum 1-hour average concentrations
Annual - 17.0 ppb 12.0 ppb The average over a single calendar year of all 1-hour average concentrations
Sulphur dioxide (SO2) 1-hour - 70 ppb 65 ppb The 3-year average of the annual 99th percentile of the SO2 daily maximum 1-hour average concentrations
Annual - 5.0 ppb 4.0 ppb The average over a single calendar year of all 1-hour average SO2 concentrations

Air Zones and Airsheds

Air zones and airsheds are used to manage air quality at the local and regional levels respectively.


Select an air-zone and follow the link above the map to learn more.

CAAQS Management Levels

CAAQS are supported by four colour-coded management levels. Each management level is determined by the amount of a pollutant within an air zone and provides recommended air quality management actions. If the amount of a pollutant within an air zone increases, the management actions become more stringent. This helps ensure that CAAQS are not treated as pollute-up-to levels and actions will be taken to keep clean areas clean.

When determining the CAAQS management levels, provinces and territories can consider the influence of human activities originating outside of the province or territory and of exceptional events such as forest fires.

Air quality management levels Management Levels for Fine Particulate Matter CAAQS Management Levels for the Ozone CAAQS Management Levels for Nitrogen dioxide CAAQS Management Levels for Sulphur dioxide CAAQS
24-hour (micrograms per cubic metre) Annual (micrograms per cubic metre) 8-hour (parts per billion) 1-hour (parts per billion) Annual (parts per billion) 1-hour (parts per billion) Annual (parts per billion)
2015 2020 2015 2020 2020 2025 2020 2025 2020 2025 2020 2025 2020 2025
Red >28 >27 >10.0 >8.8 >62 >60 >60 >42 >17.0 >12.0 >70 >65 >5.0 >4.0
Orange 20 to 28 20 to 27 6.5 to 10.0 6.5 to 8.8 57 to 62 57 to 60 32 to 60 32 to 42 7.1 to 17.0 7.1 to 12.0 51 to 70 51 to 65 3.1 to 5.0 3.1 to 4.0
Yellow 11 to 19 4.1 to 6.4 51 to 56 21 to 31 2.1 to 7.0 31 to 50 2.1 to 3.0
Green ≤10 ≤4.0 ≤50 ≤20 ≤2.0 ≤30 ≤2.0

CAAQS Achievement & Management Level

Provinces and territories regularly publish air zone reports on CAAQS achievement and management level. This map shows the most recent available* CAAQS achievement or management level for each pollutant across Canada.

Achievement means that the measured air pollutant concentration in an air zone does not exceed the CAAQS numerical value. These measurements can be influenced by human activities originating outside of the province or territory and by exceptional events such as wildfires.

Management level is determined by the amount of pollutant within an air zone and provides recommended air quality management actions. Provinces and territories can adjust for the influence of human activities originating outside of the province or territory and for exceptional events such as wildfires.

*The achievement of 2020 CAAQS and associated management level were determined by provinces and territories using ambient concentrations measured in the air zones for one of the following three-year periods: 2017-2019, 2018-2020, 2019-2021 or 2020-2022.


Select an air-zone and follow the link above to learn more.

Sources of Pollutant Emissions in 2019

Emissions of air pollutants come from human activities and natural causes. This chart presents emissions from human-activities only. Percentages are measured against a Canada-wide total which excludes open sources (like road dust) and natural sources (like forest fires).

Source: Environment and Climate Change Canada, 2021. Air Pollutant Emissions Inventory

Download Data

Canada-Wide Air Pollutant Emissions Trends Over Time

Overall, air pollutant emissions have decreased since 1990. Governments, businesses and individual Canadians have all contributed to these achievements. This chart shows the percentage change in emissions from 1990 levels of four key air pollutants.

Source: Environment and Climate Change Canada, 2021. Air Pollutant Emissions Indicators

Download Data

Ambient Trends by Pollutant

The ambient air we breathe contains air pollutants at various concentrations. This graph shows Canada-wide average concentrations by pollutant and year.

There is a strong relationship between ambient concentrations and the pollutant emissions shown on the next page.

Source: Environment and Climate Change Canada, 2022. National Air Pollution Surveillance Program

Download Data

Emission Trends by Source

This chart shows pollutant emissions from key sectors for each pollutant.

Source: Environment and Climate Change Canada, 2021. Air Pollutant Emissions Inventory

Download Data

Pollutant Emissions by Province and Territory

Emissions vary by source and by province and territory. Overall emissions are decreasing across Canada.

The emission trends were compiled by Environment and Climate Change Canada and may differ from those compiled by provinces and territories.

Source: Environment and Climate Change Canada, 2021. Air Pollutant Emissions Inventory

Download Data

Acid Rain

Acid rain, also known as acid deposition, continues to damage Canadian ecosystems. Acidification of lakes and streams makes the water unsuitable to support some fish and other plants and animals. Acid deposition damages forest soils by stripping the soil of nutrients and increasing the release of toxic chemicals such as aluminium, as well as directly damaging some sensitive tree species.

In October 1998, federal, provincial and territorial energy and environment ministers signed The Canada-Wide Acid Rain Strategy for Post-2000 to provide a framework for addressing the problem of acid deposition.

Regular reporting on emissions of SO2 and NO2 (chemicals that react to form acid rain) and acid deposition trends can be found in the biennial Canada - United States Air Quality Agreement progress report.

The maps on the right show the spatial patterns of five-year average annual wet nitrate and sulphate deposition (the primary indicators of acid deposition) in Canada and the United States from 1981 to 2020. The maps also show point values measured at stations in less densely measured regions in western and northern Canada. Wet nitrate deposition is measured in kilograms of nitrate per hectare per year (kg NO3- ha-1 yr-1). Wet sulphate deposition is measured in kilograms of non-sea-salt sulphate per hectare per year (kg xSO4-2 ha-1 yr-1). Significant reductions in the wet deposition of both sulphate and nitrate have occurred in eastern Canada and the eastern United States.

Source: Environment and Climate Change Canada, 2023. Wet Deposition Maps

Improving our air quality benefits Canadians

Canadians have already benefited from actions to improve air quality. Between 2000 and 2011, fine particulate matter, a main pollutant in smog, declined in many parts of Canada, particularly in Ontario and Québec. The improved air quality in 2011 is estimated by Health Canada1 to have prevented:

  • 4,100 deaths
  • 2200 hospital visits
  • 770,000 asthma events

There were also 11 million fewer instances where Canadians experienced breathing symptoms and 5.7 million fewer occasions where someone restricted their activity by, for example, not attending work or school due to health problems made worse by air pollution.

A number of actions contributed to the reduction of fine particulate matter and other air pollutants in Canada such as improved emission standards for vehicle engines and fuels, and better controls of air pollutant emissions from industrial sources such as power plants.

Stieb, David M. et al. Estimated public health impacts of changes in concentrations of fine particle air pollution in Canada, 2000 to 2011. Can J Public Health ,[S.I.], v. 106, n. 6, p., e362-e368, jun. 2015. ISSN 1920-7476

Air Quality Actions

Canadians can take action in their everyday lives to improve air quality. These actions can range from selecting your means of transportation; to actions at home or at the office; to modifying your purchasing habits.

You can find more tips and information if you search the web for local programs and environmental organizations in your part of Canada.

Transportation

Your transportation choices have an effect on air quality. Compared to driving a single-occupant vehicle, many options are cleaner, healthier and cheaper to operate. Here are a few:

  • use public transit
  • walk or ride a bicycle
  • drive an electric or hybrid vehicle or
  • try carpooling.

If you do drive a vehicle, regular maintenance will help reduce the emissions coming out of your tailpipe. Good maintenance habits include:

  • regular oil changes
  • maintaining the proper tire pressure and
  • getting regular tune-ups.

Home

Your actions at home can help improve air quality. Some of these actions may seem simple but their benefits add up over time:

  • insulate your home and install good quality windows and doors
  • use programmable thermostats for your furnace and air conditioning
  • buy products locally or try growing some of your own food
  • use a push-mower instead of a gas-mower for your lawn
  • turn off the lights when you leave a room.

Office

Your choices at work can help reduce air pollutant emissions. Many of the energy-saving actions that you practice at home may apply to the office. Other actions include:

  • provide bicycle racks for your employees
  • maintain the property with tools that use (green) electricity or human power
  • post “no-idling” signs in parking lots and drop-off areas
  • do business with other “green” vendors and services.

Consumer Behaviour

What you buy and where you shop has an environmental impact. So to help the environment and to reduce air pollution, these tips can help:

  • purchase brands that promote and support environmental sustainability
  • buy locally made or grown products that require less shipping
  • buy products with less packaging and that have used less resources when manufactured
  • buy products that release fewer air pollutants
  • repair, reduce, reuse and recycle what you can
  • research the products and brands that you use; a quick web search can answer a lot of questions.